

SIP vs Gold: Which Builds More Wealth Over 20 Years?
(Data verified: 23 October 2026)
Maybe someone in your family has been telling you to move your SIP money into gold. Looking at the last twelve months, they have a point. Gold in India is up about 22% in a year. The Nifty 50 is down about 10%.
But ask a simple follow-up: which one has built more wealth over 20 years? The answer is more surprising, and more careful, than either camp admits.
Here is the short version. Over the 20 years to October 2026, gold has grown at about 15% a year in India, ahead of the Nifty 50’s roughly 11% to 12% a year including dividends. Gold wins that race. But the lead is built on the last three years, on a falling rupee, and on a path that included six years of going nowhere. Neither asset is “better” in the abstract. They are different tools that win in different conditions.
This guide uses data as of 23 October 2026 to compare an equity SIP with gold across returns, the rupee, costs, tax, risk and behaviour. It shows the numbers, explains what drove them, and does not tell you what to buy.
SIP vs Gold: Where Things Stand in October 2026
First, the setting. A year ago the story was “gold only goes up”. Today it is more mixed.
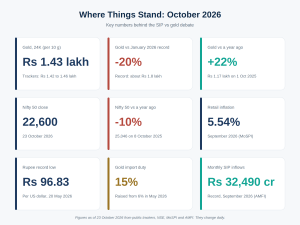
| Measure (as of 23 October 2026) | Figure |
| 24K gold, India (per 10 grams) | About ₹1.43 lakh (trackers range ₹1.42 to ₹1.46 lakh) |
| Gold’s record in India (late January 2026) | About ₹1.79 to ₹1.83 lakh per 10 grams, depending on the tracker |
| Gold vs that record | About 20% below |
| Gold vs a year ago | About 22% higher (₹1.17 lakh on 1 October 2025) |
| Gold, global record | About $5,590 an ounce, 28 January 2026 |
| Gold, global, early October 2026 | About 26% below that record |
| Nifty 50 close | 22,600 (down about 10% from 25,046 on 8 October 2025) |
| Retail inflation (September 2026) | 5.54% |
| Rupee | Record low of ₹96.83 per US dollar on 20 May 2026 |
| India’s gold import duty | Raised from 6% to 15% in May 2026 |
| Monthly SIP inflows (September 2026) | Record ₹32,490 crore, from 10.06 crore SIP accounts |
| Gold ETF net inflows (September 2026) | ₹4,451 crore. Gold ETF assets have roughly doubled in a year (up 106.7%). |
Two things stand out. Investors are still putting a record amount into SIPs, and money is also flowing into gold ETFs at a rising pace. And the best-performing asset of the last year (gold) has already fallen about 20% from its peak. That is why the question needs more than a one-year answer.
What Are We Actually Comparing?
An SIP is a method, not an asset. A Systematic Investment Plan puts a fixed amount into an investment every month. Most people mean an SIP in an equity mutual fund, often an index fund tracking the Nifty 50. That is what we use here.
Gold is an asset. It can also be bought regularly, in a “gold SIP”. So the real comparison is:
- Equity SIP: you own a slice of many companies. Your return comes from business growth and dividends.
- Gold, bought regularly or in one go: you own a metal that pays nothing. Your return comes only from its price changing.
There are several ways to own gold, and they differ in tax, cost and safety:
| Way to hold gold | Notes (October 2026) |
| Gold ETF | Listed units backed by gold. Needs a demat account. Regulated by SEBI. |
| Gold mutual fund (fund of funds) | Invests in gold ETFs. No demat needed. Lets you run a regular SIP. |
| Sovereign Gold Bond (SGB) | Closed to new buyers. The last issue was in February 2024. Existing bonds run to maturity. |
| Digital gold | Bought through apps. SEBI said in November 2025 that it is outside its oversight. |
| Physical gold (coins, bars, jewellery) | Carries GST, making charges and storage. Jewellery loses value on resale. |
The 20-Year Scoreboard: October 2006 to October 2026
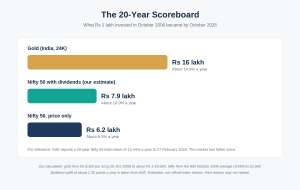
Here is the plain comparison, with how each number was worked out.
| Gold (India, 24K) | Nifty 50 | |
| Starting point | About ₹8,920 per 10g (31 October 2006) | Monthly average 3,649 (October 2006) |
| Ending point | About ₹1.43 lakh (23 October 2026) | 22,600 (23 October 2026) |
| Total multiple | About 16 times | About 6.2 times (price only) |
| Annual growth (CAGR) | About 14.9% | About 9.5% price. About 10.9% with dividends (our estimate). |
| What ₹1 lakh in October 2006 became | About ₹16 lakh | About ₹6.2 lakh (price) or about ₹7.9 lakh (with dividends) |
How we calculated this: gold from a 31 October 2006 24K rate (₹892 a gram, Chennai) and about ₹1.43 lakh now, taken as the middle of several trackers. Nifty from the RBI Bulletin’s October 2006 average and the 23 October 2026 close, plus about 1.35 percentage points for dividends, which is the gap between NSE’s total-return and price-return figures. Treat these as close estimates, not official index returns.
For reference, other published figures agree: NSE’s Nifty 50 Whitepaper shows a 20-year total return of 12.44% a year for the period to 27 February 2026, and independent compilations put gold’s 20-year return at about 15%. The Nifty’s number is lower today than in February because the market has fallen since then. The Nifty traded near 23,800 in mid-March 2026 and closed at 22,600 on 23 October.
So yes, on this 20-year window, gold built more wealth than the Nifty 50. The rest of this article is about why that headline is easy to misread.
Why the Headline Needs a Closer Look
1. The finish line matters more than people think
A 20-year CAGR depends heavily on where the 20 years end. NSE’s own 20-year total return for the Nifty 50 was 12.44% in February 2026. Our estimate for October 2026 is about 10.9%. In that time the index fell roughly 10% and the 20-year window moved eight months later. Together, these cut the 20-year figure by more than a percentage point.
Gold works the same way, in the other direction. One published compilation put gold’s 3-year return at about 38% a year to early 2026. A few very strong recent years can lift a 20-year average a lot.
2. Gold’s strongest stretch is also its most recent
Gold’s recent run was exceptional. Global gold rose around 67% in 2025 and then hit a record on 28 January 2026. In India, the price reached roughly ₹1.8 lakh per 10 grams. Since then it has fallen about 20% to around ₹1.43 lakh.
Earlier this year, forecasts were asking whether gold could reach ₹2 lakh. Now the question is whether the top is in. Both questions are about price, not value. Gold has no earnings to anchor it.
3. Leadership has flipped, more than once
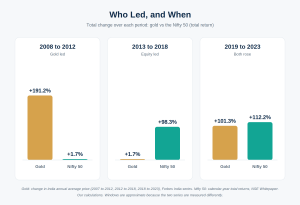
This is the most useful chart-in-words in the whole article. Using calendar-year data:
| Period | Gold (India, annual average price) | Nifty 50 (total return) |
| 2008 to 2012 | Rose from ₹10,598 (2007) to ₹30,859 (2012). About 2.9 times, or about 24% a year. | 2008: −51.3%. 2009: +77.6%. 2010: +19.2%. 2011: −23.8%. 2012: +29.4%. Just +1.7% in total over five years. |
| 2013 to 2018 | ₹30,859 (2012) to ₹31,391 (2018). Up 1.7% in six years. At the low in 2015 it was about 19% below 2012. | Up about 98% in total, about 12% a year. |
| 2019 to 2026 | Annual average rose from ₹31,391 (2018) to ₹63,203 (2023), about 2.0 times, then a record in January 2026 | 2019: +13.5%. 2020: +16.1%. 2021: +25.6%. 2022: +5.7%. 2023: +21.3%. 2024: +10.1%. Down about 10% in the last twelve months (price). |
Sources: gold annual averages from Forbes India’s historical series; Nifty 50 total-return calendar-year data from NSE’s Nifty 50 Whitepaper (March 2026). Calculations are ours.
An investor who started a 20-year SIP in 2006 lived through all three regimes. Gold led in the first, equity led in the second, and gold has led again in the last few years. The 20-year result is the blended outcome of those swings, not a verdict on either asset.
4. A big part of gold’s Indian return is the rupee
Gold is priced in dollars. In India you pay in rupees. So a falling rupee lifts the rupee price of gold even if global gold does nothing.
A rough split of the 16-fold rise in India’s gold price since October 2006:
- About 69% came from gold’s rise in dollars. The global price went from about $600 an ounce in October 2006 to about $4,100 now, roughly 10% a year.
- About 27% came from the rupee falling from about ₹45 to the mid-₹90s per dollar. That is about 3.8% a year. The rupee touched a record low of ₹96.83 on 20 May 2026.
- About 4% came from duties and local premiums.
(Approximate decomposition, our calculation.)
For an Indian investor, that rupee effect is a feature, since gold protected purchasing power as the currency weakened. But it is not a repeatable source of return. It depends on the rupee continuing to fall.
5. Gold’s long sleep in real terms
Gold’s record in January 1980 was about $850 an ounce. Adjusted for inflation, that is roughly $3,300 to $3,600 in 2026 dollars. By one analysis, gold only set a true inflation-adjusted record in January 2026, having failed to do so in 2011 and in 2020.
In plain terms: someone who bought gold at its 1980 peak waited more than four decades to get back to even in real terms. Gold can be a great holding for periods. It can also be dead money for very long stretches.
What Each Asset’s Returns Actually Come From
This is the structural difference.
Equity (the Nifty 50): Companies earn profits, pay some as dividends, and reinvest the rest. Over time, the index tends to follow earnings growth, helped by India’s economic growth. That gives equity a reason to rise beyond sentiment. The price can still be far from fair for years, as the 2008-12 flat patch shows.
Gold: It produces nothing. No dividends, no interest, no profits. Its price reflects what other people will pay. Typical drivers include the dollar, real interest rates, central bank buying, geopolitical fear and, for Indian buyers, the rupee and import duty. The January 2026 record was linked to geopolitical tension and currency worries, and a correction followed anyway.
Neither description makes one a better investment. It means they behave differently, and that is exactly why they are sometimes held together.
What Could ₹10,000 a Month Become? A Scenario Table
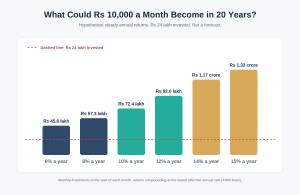
Now the SIP maths. This table is hypothetical. It shows what a ₹10,000 monthly SIP for 20 years (₹24 lakh invested) could become at different steady annual returns. It is not a forecast for either asset.
| Assumed return a year | Final corpus | Multiple of money invested |
| 6% | about ₹45.6 lakh | 1.9 times |
| 8% | about ₹57.3 lakh | 2.4 times |
| 10% | about ₹72.4 lakh | 3.0 times |
| 12% | about ₹92.0 lakh | 3.8 times |
| 14% | about ₹1.17 crore | 4.9 times |
| 15% | about ₹1.33 crore | 5.5 times |
Assumes ₹10,000 invested at the start of each month, returns compounding at the stated effective annual rate (the way XIRR works). Online calculators that divide the annual rate by 12 will show slightly higher values.
How to use it: if you believe equity will return about 11% to 12% and gold about 8% to 10% from here, the table shows the gap in rupees. If you believe the opposite, it shows that gap instead. The honest point is that a few percentage points a year is worth tens of lakhs over 20 years, and nobody knows which asset will have the higher number.
One published backtest (by Grade Capital, not independently verified by us) ran a ₹10,000 monthly SIP from January 2016 to April 2026. It found an annualised return of about 12.2% for the Nifty 50 and about 24.8% for gold over that ten-year period, with gold’s rally concentrated at the end. Even if you accept the figures, they only describe that one window.
After inflation, the picture shifts
India’s retail inflation was 5.54% in September 2026, and has averaged roughly 5% to 6% over the past 20 years.
| Nominal return | Real return at 5.5% inflation |
| Gold, about 14.9% | About 8.9% |
| Nifty 50 with dividends, 12.4% (NSE, February 2026) | About 6.6% |
| Nifty 50 with dividends, about 10.9% (our October 2026 estimate) | About 5.1% |
Both beat inflation comfortably over this period. A fixed deposit at 6% to 7% before tax would be close to flat in real terms. If you also want to compare SIPs with deposits, see SIP vs fixed deposit.
Costs and Friction: Gold Has More Than It Looks
Gold:
- Import duty. India raised the effective duty on gold from 6% to 15% in May 2026. It is built into domestic prices. Reports differ on how the 15% splits between basic duty and cess, but the total is consistent.
- GST. 3% on physical and digital gold. 5% on jewellery making charges.
- Making charges and resale loss. Jewellery making charges are paid on purchase and are generally not recovered on resale. Bars and coins carry smaller premiums.
- Storage and purity. Lockers, insurance and the risk of impure gold.
- ETF and fund costs. An annual expense ratio, plus demat and brokerage charges for ETFs.
Equity SIP:
- The fund’s expense ratio, which is lower for index funds than for most active funds.
- Exit load in some funds if you sell early.
An ETF or fund removes most of gold’s physical friction. Physical jewellery is the costliest way to hold gold as an investment, and is best treated as consumption.
How Gains Are Taxed in 2026-27
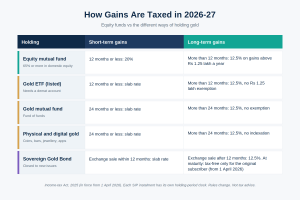
These rates apply under the Income-tax Act, 2025, which has been in force since 1 April 2026.
| Holding | Short-term | Long-term |
| Equity mutual fund (65%+ domestic equity) | 12 months or less: 20% | More than 12 months: 12.5% on gains above ₹1.25 lakh a year |
| Gold ETF (listed) | 12 months or less: slab rate | More than 12 months: 12.5%, no ₹1.25 lakh exemption |
| Gold mutual fund (fund of funds) | 24 months or less: slab rate | More than 24 months: 12.5%, no ₹1.25 lakh exemption |
| Physical gold and digital gold | 24 months or less: slab rate | More than 24 months: 12.5%, no indexation |
| Sovereign Gold Bond | Sold on the exchange within 12 months: slab rate | Sold on the exchange after 12 months: 12.5%. At maturity: tax-free only for the original subscriber who holds to the end (from 1 April 2026) |
Practical points:
- Gold’s long-term rate matches equity’s at 12.5%, but equity gets a ₹1.25 lakh annual exemption and gold does not.
- A gold ETF becomes long-term after 12 months. A gold fund, physical gold and digital gold take 24 months.
- In an SIP, each monthly instalment starts its own holding-period clock. A 20-year SIP is mostly long-term, but your recent instalments are still short-term.
- Equity mutual funds and gold investments are both taxed only when you sell.
Tax rules change with budgets. Confirm with a tax professional before you sell.
Risk and Behaviour: How Each One Hurts
Equity falls hard, then recovers. The Nifty 50’s total return was −51.3% in 2008 and −23.8% in 2011. It has had three negative years in the 20 calendar years from 2005 to 2024. Equity SIPs can feel painful for years before they pay off.
Gold falls too, but at different times. In 2008, the Nifty fell about 51% while India’s average gold price rose about 29%. Studies of the Covid and Ukraine shocks also found gold up while the Nifty fell. But gold has also fallen hard on its own. India’s gold price is about 20% below its January 2026 peak, and global gold is down roughly a quarter.
Behaviour is the bigger risk. Two patterns repeat:
- Chasing last year’s winner. Gold ETF assets doubled in a year, after gold had already risen sharply. Buying at the end of a big run feels safe and often isn’t.
- Quitting after a loss. A negative year for the Nifty is exactly when many investors stop SIPs.
An equity SIP works only if you keep going through falls. A gold holding works only if you do not buy the top or sell the bottom. Neither is easy.
Safety and Regulation
- Gold ETFs and gold mutual funds are SEBI-regulated products with disclosures and a daily price.
- Digital gold is not a regulated security. SEBI’s advisory of 8 November 2025 said digital gold products are outside its purview and carry no investor-protection mechanism. Keep amounts small, if you use it at all.
- Sovereign Gold Bonds have stopped. No new tranche has been issued since February 2024, and from 1 April 2026 the tax-free maturity benefit applies only to original subscribers who hold to maturity. Buying existing SGBs on the exchange no longer gets you that benefit.
- Physical gold needs purity checks and safe storage. Hallmarked jewellery helps with purity, but not with price risk.
Can You Do Both? A Practical Framework
This is not either-or. A lot of long-term investors think in terms of roles:
- Growth engine: equity, usually through SIPs. It aims to grow the money.
- Diversifier: gold, a modest and pre-decided share. It aims to behave differently when equity struggles.
- Stability: deposits and debt funds for money you need within a few years.
A few ideas that keep this simple:
- Decide the share in advance. A fixed allocation to gold stops you from raising it only after a rally.
- Rebalance occasionally. If gold has jumped and become a much larger share of your portfolio, you can trim it back, and the same applies the other way round.
- Match the asset to the goal. A 20-year retirement goal can bear equity swings. Money needed in two years should not depend on either.
- Keep gold separate from jewellery. Wedding jewellery is consumption. Investment gold is a portfolio decision.
This is general guidance. The right split depends on your goals, income and risk comfort.
Who Might Lean Toward Which?
An equity SIP may suit you if you:
- Are investing for a goal 10 years or more away
- Want your money linked to the growth of businesses
- Can sit through a 30% to 50% fall without stopping
- Want the benefit of the ₹1.25 lakh annual exemption on long-term gains
Gold may suit you if you:
- Want something that has often moved differently from equity
- Are worried about inflation and a weak rupee
- Want a small diversifier alongside equity, not a replacement
- Are buying through an ETF or fund, not jewellery
Many investors hold both, with equity as the larger share. Neither choice removes the need to keep an emergency fund and adequate insurance first.
See Your Whole Portfolio Before You Add Gold
Before adding gold, it helps to know what you already hold. Many people discover they already have gold exposure through a multi-asset or hybrid fund, a gold ETF bought in a rush last year, or old gold funds started years ago.
Your Consolidated Account Statement (CAS) lists your mutual fund holdings across all fund houses, and the depository version also shows ETFs held in your demat account. A tool like CAS Analyser can turn that statement into an organised view of your asset allocation, overlap and concentration. That shows your equity-to-gold balance clearly, before you decide whether to change it. If you are new to reading the statement, start with how to read a CAS statement. To avoid piling on funds that do the same job, see how many mutual funds you should actually hold.
Not Sure How Much Gold or Equity Is Right for You? Talk to a Financial Planner
Data can tell you what happened. It cannot tell you what suits your life. The right split between an equity SIP and gold depends on your goals, your timeline, your income stability and how you would react to a bad year.
That is the kind of question we help with at Financial Friend. Our founder, Gunjan Kataria, is a Certified Financial Planner (CFP®) and Certified Trust & Estate Planner (CTEP) with over 14 years of experience in financial services. We work with individuals and families on goal-based financial planning, investment planning, mutual fund investments, retirement planning, tax planning and wealth management.
If you would like a professional review of your equity and gold mix, you can contact Financial Friend or call +91 9981998013 to book a consultation.
Financial Friend is an AMFI-registered mutual fund distributor (ARN-157982). Mutual fund investments are subject to market risks. Please read all scheme-related documents carefully before investing.
Common Mistakes When Comparing SIP and Gold
- Using a one-year number to make a 20-year decision. Gold’s last year and the Nifty’s last year tell you very little about the next 20.
- Ignoring the start and end dates. Move the finish line and the winner can change.
- Comparing jewellery with an index fund. Making charges and resale loss make jewellery a poor investment benchmark.
- Forgetting costs and tax. The 15% import duty, GST and tax rules change what you actually keep.
- Buying after a big rally. Gold ETF assets doubled in a year. The price is now about 20% off its peak.
- Stopping equity SIPs after a bad year. The Nifty’s flat 2008-12 stretch was followed by a strong run.
- Treating digital gold as regulated. It is not.
- Letting gold grow into an oversized share. A pre-set allocation prevents it.
Frequently Asked Questions About SIP vs Gold
Is SIP better than gold over 20 years? Neither wins in every period. Over the 20 years to October 2026, gold’s growth of about 15% a year beat the Nifty 50’s roughly 11% to 12% with dividends. But leadership flipped several times, so this result does not tell you which will win the next 20 years.
Which gave more returns in the last 20 years, gold or Nifty 50? In India, gold grew about 14.9% a year from October 2006 to October 2026, by our calculation. The Nifty 50 returned roughly 10.9% with dividends by our estimate, and NSE’s official figure was 12.44% to February 2026. The gold lead is real, but heavily influenced by recent years.
Is gold a better investment than mutual funds? Not categorically. Gold produces no earnings and depends on price alone. Equity mutual funds are linked to company growth but are more volatile. They behave differently, so many investors hold both, with equity usually the larger part and gold a smaller diversifier.
Should I stop my SIP and buy gold now? Switching because gold rose and the Nifty fell is a recency decision. Gold is already about 20% below its January 2026 record. Make allocation changes based on your goals and timeline, not last year’s returns, and consider speaking with a planner first.
How much of my portfolio should be in gold? There is no single right number. It depends on your goals, risk comfort and what else you own. Many investors keep gold as a modest, pre-decided share of their portfolio and rebalance occasionally. A financial planner can help set a figure that fits you.
Can I do an SIP in gold? Yes. You can run regular investments in a gold mutual fund (fund of funds) through an SIP, or buy gold ETF units regularly through your broker if it supports ETF SIPs. Each instalment is a separate purchase with its own holding period for tax.
Is gold ETF better than physical gold? For investment, usually yes. A gold ETF avoids making charges, storage and purity worries, and becomes long-term after 12 months. Physical jewellery carries making charges and resale losses, so it is better seen as consumption than investment.
How is gold taxed in 2026-27? Gold ETFs held over 12 months, and gold funds, physical gold and digital gold held over 24 months, are taxed at 12.5% on long-term gains without indexation. Shorter holdings are taxed at your slab rate. The ₹1.25 lakh exemption available on equity funds does not apply to gold.
Is digital gold safe? Digital gold is not a regulated security. SEBI’s 8 November 2025 advisory said it falls outside its purview and offers no investor-protection mechanism. If you use it, keep amounts small and use a well-known platform. Gold ETFs and gold funds are regulated alternatives.
Can I still buy Sovereign Gold Bonds? Not from the government. No new SGB tranche has been issued since February 2024. You can buy existing bonds on the exchange, but from 1 April 2026 the tax-free maturity benefit applies only to original subscribers who hold until maturity.
Why did gold fall in 2026 after hitting a record? Gold hit a record on 28 January 2026 and has since fallen about 20% in India and roughly a quarter globally. Gold prices respond to the dollar, interest rates, central bank buying and sentiment, so sharp swings after a big rally are not unusual. No one can predict the next move.
Does the 2026 gold import duty hike matter to investors? Yes. India raised the effective import duty on gold from 6% to 15% in May 2026, which is built into domestic prices. It adds to the cost of buying physical gold and can widen the gap between Indian and international gold prices.
Does gold beat inflation? Over the last 20 years, gold’s roughly 15% a year growth comfortably beat inflation of about 5% to 6%. But gold has also gone nowhere for long stretches, such as 2012 to 2018, when its price was almost flat while inflation continued.
What happens to an equity SIP when the market falls? Your SIP keeps buying units at lower prices, which can lower your average cost. The value of existing units falls, though, and recovery can take years. The Nifty 50’s total return was roughly flat across 2008 to 2012 before a strong run.
How do I see how much gold I already own? List your gold funds, gold ETFs, SGBs and physical gold. Your CAS statement shows mutual fund holdings across fund houses, and a depository CAS also shows ETFs in your demat account. CAS Analyser can organise this into one view of your equity and gold balance.
Is it a good time to invest in gold in October 2026? Nobody can time it. Gold is about 20% below its January record and about 22% above where it was a year ago. If you want gold, a pre-decided allocation built up gradually may reduce the risk of buying at a peak, but the right amount depends on you.
Conclusion
So, which builds more wealth over 20 years, an SIP or gold?
Looking back at the 20 years to October 2026, gold did, at about 15% a year against roughly 11% to 12% for the Nifty 50. But that result was shaped by a falling rupee, a historic rally in the last three years, and an end date picked just after gold’s best stretch. The same data shows gold flat for six years, and the Nifty flat for five.
Looking ahead, the difference is structural. Equity is tied to businesses that earn and grow. Gold depends on what others will pay for it. They can both help you, in different roles, at different times.
Start with what the money is for, decide a mix you can stick to through bad years, and review it once a year. If you invest in mutual funds already, begin by seeing your complete portfolio in one place. Upload your CAS to CAS Analyser to understand what you own, how it is allocated and where overlaps may exist.
Analyse Your Mutual Fund Portfolio with CAS Analyser
This article is for educational and informational purposes only and does not constitute personalised investment, tax or legal advice. Past performance may not be repeated. Return figures for gold and the Nifty 50 are point-to-point and approximate, and the SIP scenarios are hypothetical, not forecasts. Tax rates, duties and regulations change; verify current rules with a qualified professional before making financial decisions.
Ready to Know What’s Really in Your Portfolio?
CAS Analyser by Financial Friend is the simplest way to analyse your mutual fund portfolio without a spreadsheet, a financial advisor, or hours of manual work.
✅ Instant portfolio overview across all AMCs
✅ Identify overlap and duplicate holdings
✅ Spot portfolio clutter and zombie funds
✅ Understand your true asset allocation
✅ Free to use — no signup required
→ Analyse Your Mutual Fund Portfolio Now
Visit – https://casanalyser.com/
Have questions about your portfolio? Connect with Jaipur’s Trusted Mutual Fund Advisor Financial Friend.
Also Read our Complete Guide to Analyse Your Mutual Fund CAS Statement
Want to know SIP vs Real Estate ? Read our blog – https://www.financialfriend.in/sip-or-real-estate-a-practical-guide-for-indian-investors/
About the Author
Hi, I’m Gunjan Kataria, Founder at Financial Friend in Jaipur.
As a Certified Financial Planner (CFP) and Chartered Trust and Estate Planner (CTEP), I specialize in customized strategies that align with clients’ unique risk profiles and financial goals, enabling them to make informed decisions for wealth growth and management.
I help working professionals, women, parents, retirees, and first-time investors make smart money decisions without the jargon.
With years of experience guiding people through budgeting, saving, investing, and retirement planning, I’ve seen one truth:
— Most people don’t need complicated strategies, they need a clear, personalised plan they can actually follow.
What I do:
- Help you build wealth while enjoying your present life
- Create customised money plans based on your goals & lifestyle
- Break down complex financial concepts into easy, actionable steps
- Provide guidance that’s trustworthy, friendly, and free from product-pushing
I believe personal finance isn’t just about numbers, it’s about freedom, security, and peace of mind.
Whether you’re:
🔹 Starting your career and want to avoid costly money mistakes
🔹 A professional in IT or other fast-paced industries seeking clarity in your finances
🔹 A High Net Worth Individual (HNI), CEO, or business owner wanting a trusted partner to optimize wealth and secure your legacy
🔹Preparing for retirement and aiming for peace of mind
🔹 Or simply looking to manage your money better
I’m here to be your trusted guide and partner in the journey.
Let’s connect and talk about how you can take control of your finances, grow your wealth, and design a life you truly love.
Connect with Us on Social Media for Latest Finance Updates
Linkedin: https://www.linkedin.com/in/gunjan-kataria-financecoach/
Facebook: https://www.facebook.com/financialfriend.in/
Instagram: https://www.instagram.com/financialfriend.in/
Youtube: https://www.youtube.com/channel/UC9lV6UXOuBdvK7lLNsbQGaA
E-mail: gunjan@financialfriend.in